DISCLAIMER: NOT FINANCIAL ADVICE
I am not a licensed financial professional. All content I share represents my personal trading activities, observations, and opinions. My posts may contain errors or inaccuracies and are shared for informational and entertainment purposes only. Nothing I publish constitutes financial advice, investment recommendations, or trading strategies.
Trading stocks, options, and other securities involves substantial risk of loss and is not suitable for everyone. Futures trading can incur high risk as it is a leveraged product. You are responsible for your own trades and your own education on how to trade these products.
Before engaging in any trading or investing activity, understand the risks involved and consider consulting with a qualified professional. You alone are responsible for evaluating the information I provide and for all your investment decisions.
How I Use SPXMoves: My Weekly Process
Introduction
This guide outlines my personal approach to using SPXMoves throughout the trading week. This represents my own methodology and is not intended as financial or trading advice. Each trader should develop their own strategy and risk management approach. I'm simply sharing how I interpret and use the data that SPXMoves provides.
It's important to understand that you are responsible for your own trading and what vehicles you choose to trade. Some users buy SPX options at key levels, while others sell SPX options at these same levels. Many trade futures contracts with or without stops. Some prefer using these levels to buy 0DTE SPY options. Your trading vehicle is your choice, your entries are your own, and your interpretation of the stats are your own. While I share my thoughts on Twitter, I do not share entries or exits until after the fact.
These are my macro trading rules that influence how I lean:
Seasonality Factors
- Feb-Mar: Typically bearish as investors sell to pay taxes
- Post-March MOPEX: Tends to show bullish momentum into spring
- June: Recently volatile due to FOMC announcements (less impactful as tariff concerns grow)
- Summer: Generally rewards long positions (exception: last August's Yen carry trade disruption)
- August (Jackson Hole): Often signals beginning of Fall Bear (corporate taxes/tax loss harvest)
- Post-October MOPEX to year-end: Historically strong for long positions (2022 bear market low led to nearly 100% rally)
Key Trading Patterns
- Trend Day Reversals: ~70% of trend days end in reversals (bullish trends create selling pressure, bearish trends generate buying)
- Friday-Monday Continuation: If Friday had a statistically significant trend day (+/-2-3% or greater), 90% chance of trend continuation on Monday
Sunday Evening: Planning the Week
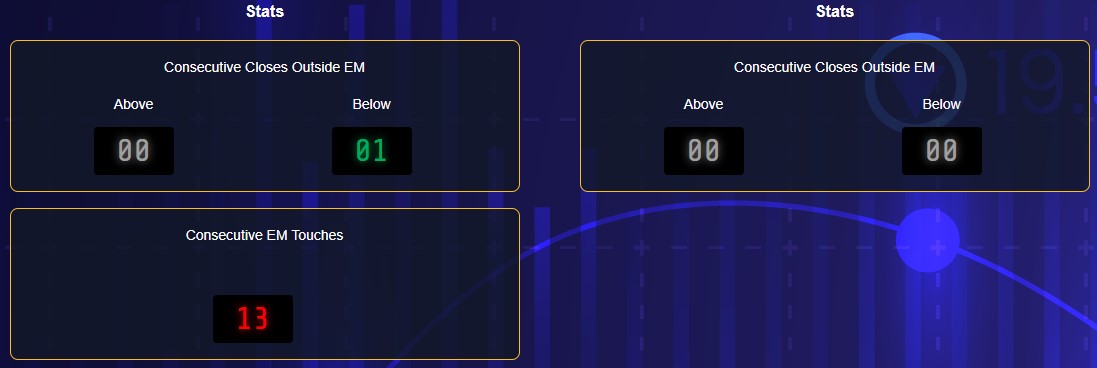
I begin my trading week on Sunday evening with a comprehensive review of the weekly stats. I'm particularly looking for consecutive closes in any given direction that might suggest a contrarian opportunity. For example, if there are two weekly closes at -1SD, the statistical probability of a third is low. This could set me up to lean bullish, but I still need to observe price action and market behavior before committing.
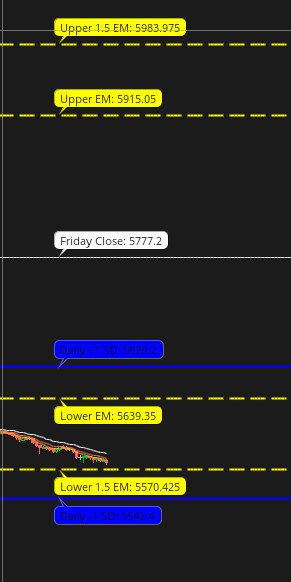
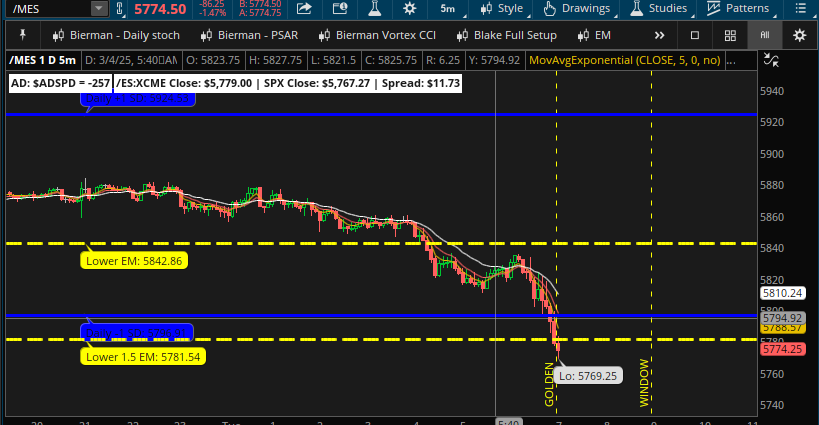
I update the levels on my ToS indicator, using golden for weekly and blue for daily, then observe the overnight price action when futures open Sunday night. Most evenings see low volatility and a tight range, but occasionally we see massive moves if significant events occur, like Russia invading Ukraine, the Yen Carry Trade blowing up, or TTT (Trump Tweets Tariffs).
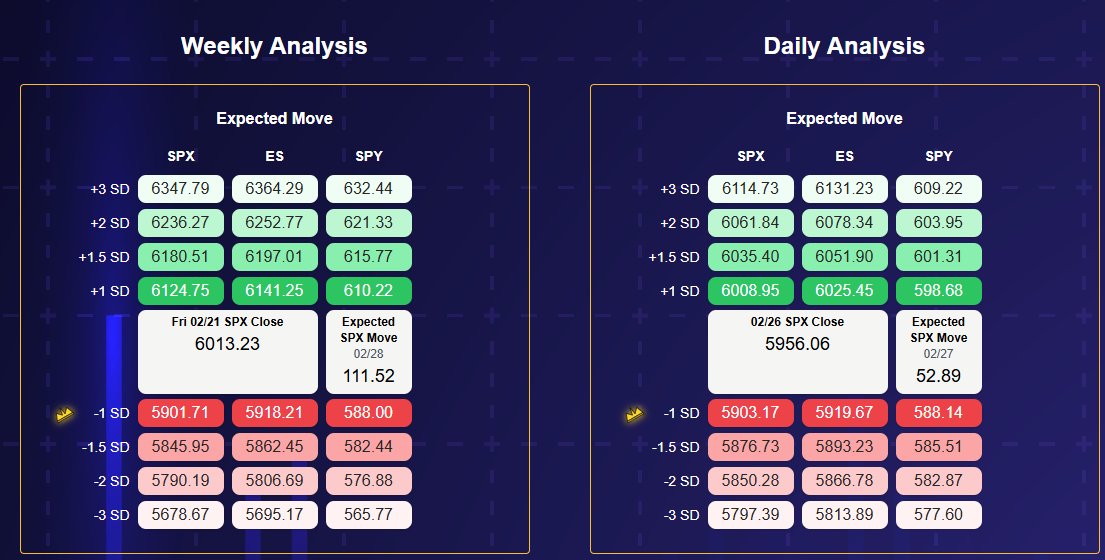
Volatility Analysis Framework
When reviewing the weekly stats, I also analyze the expected move (EM) trends:
- Rising EM: When the expected move is increasing compared to previous periods, this signals higher volatility and uncertainty - making it favorable to buy options
- Contracting EM: When the expected move is decreasing, this suggests market stabilization - creating better conditions for selling options
I compare the current expected move to both the prior week's expected move and the 1-month average. This provides context for whether volatility is expanding or contracting relative to recent market conditions. Significant deviations from the average (especially increases) often signal potential market instability and opportunities for directional trades.
When volatility spikes, I look at the ATR. For ES, anything above 3 ATR for a Sunday open exceeds my personal risk tolerance, so I simply observe. If we hit a daily SD level on Sunday trade, I typically take the contrarian move to revert to the mean. My bias and confidence dictate whether I use a stop and how I structure the position relative to my futures portfolio. I often sell MES strangles and close them one leg at a time, with my overall thetagang positions informing my risk metrics. My primary goal is to avoid over-leveraging and getting margined out of a trade.
Monday: Establishing the Weekly Pattern
Monday begins with observation. The first 30 minutes typically reflects trade imbalance from overnight. Without a clear observed trend, I sit back and watch what the market wants to do. Recently, for instance, tariff announcements have created a pattern of immediate selloffs at market open. Buying the close and selling pre-open has been effective in the current high-volatility environment, but this strategy shifts as market conditions change. Every week establishes its own character.
About 45-60 minutes into the trading day, I can usually determine if we're in a trending or range-bound market. I first check the $ADSPD symbol on ToS to gauge advancers versus decliners.
$ADSPD Trend Indicators - My observations and opinions
- +400: Very strong trend - don't fade, likely to close on new highs if maintained into power hour
- +300: Strong trend with pullbacks - longs on pullbacks work better than shorts
- -300: Strong downtrend with short cover rallies - long positions difficult except near day's end
- -400: Likely to close on new lows - indicates market issues
- Between -300 and +300: Range day - channel patterns emerge after a few hours
I also examine VWAP and the opening range. Being below VWAP and the opening range with negative $ADSPD suggests looking for short opportunities. Conversely, trading above VWAP with positive $ADSPD and above the opening range suggests long positions. The first 60 minutes usually produces a break above or below the opening range, and the volume and momentum of this move provides valuable insight.
If we don't hit a daily SD level, I avoid forcing trades. I might sell some 0DTE premium at the +/-1.5SD daily level and close the position during power hour, which works well on range days. Trend days typically hit multiple daily SD levels (1-3SD). The daily SD provides a weaker signal than weekly levels, so breaching +1SD is acceptable, and even +2SD is fine if I understand the catalyst (CPI, earnings, FOMC, etc). Major events can override daily movements when we're trading at traditional 20-30 handle daily expected moves.
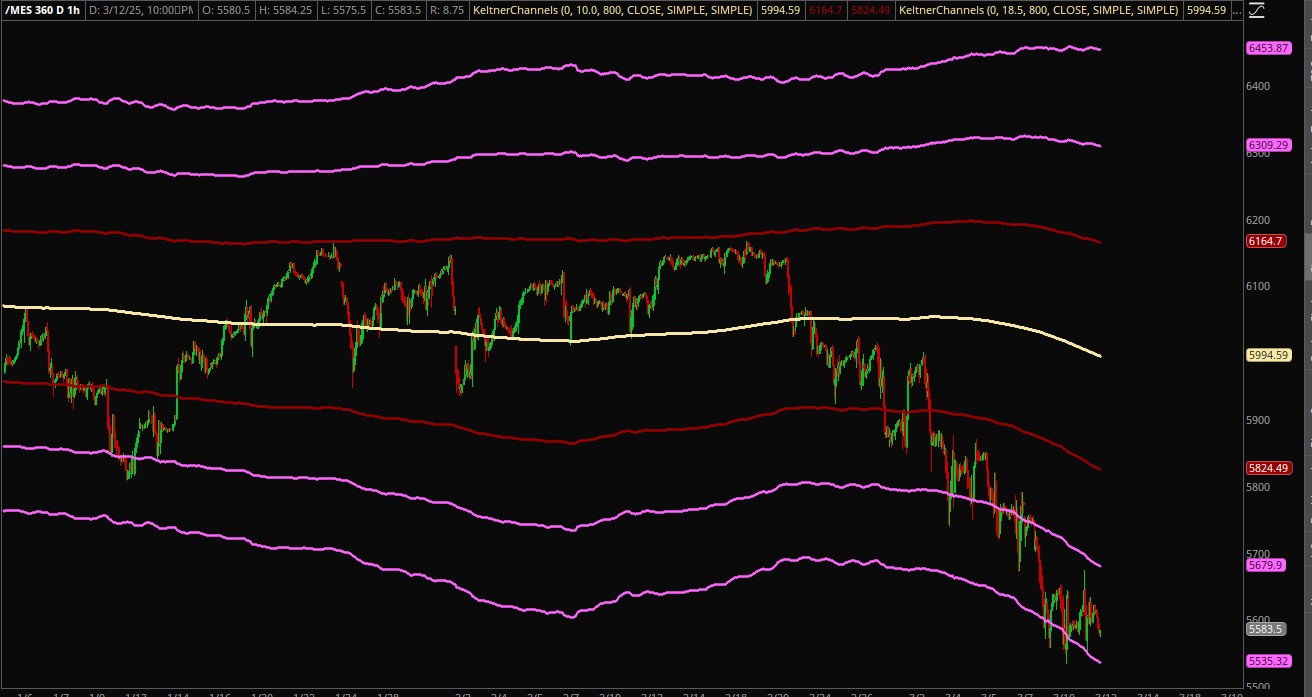
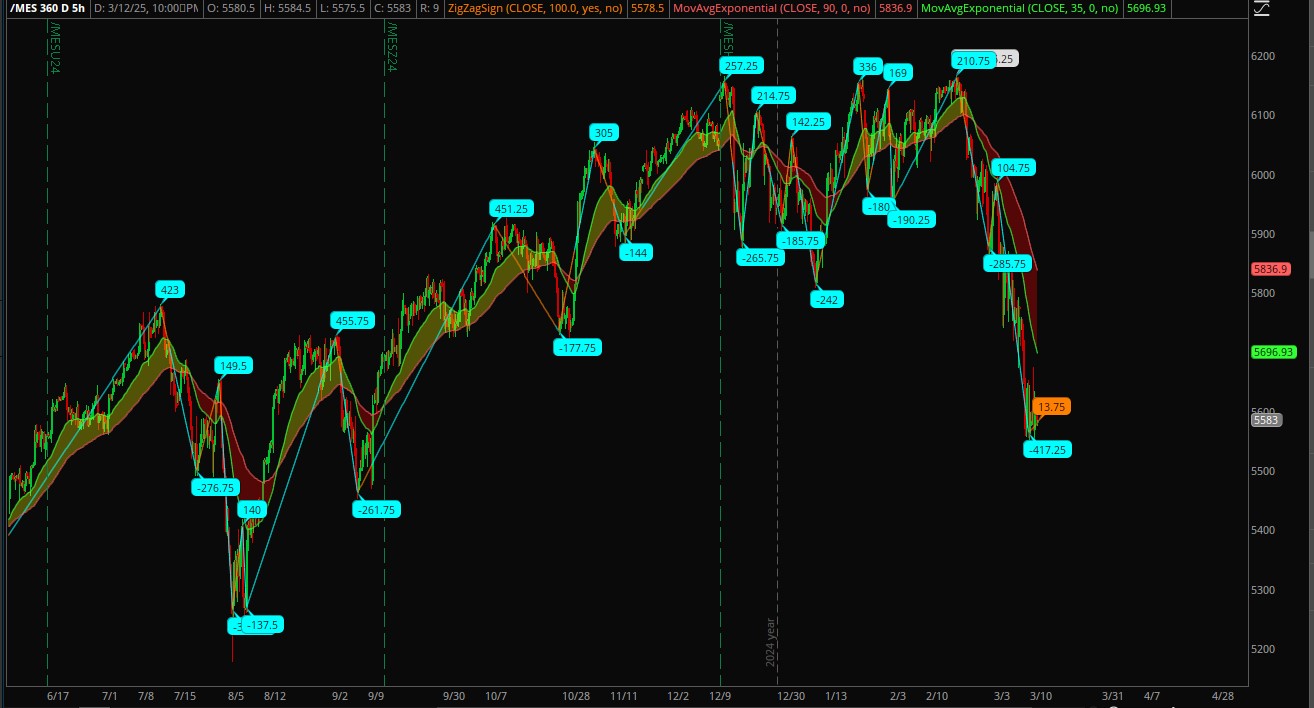
The Durango Chart, which I frequently share on Twitter, helps shape my bias. The magenta levels represent extremes, with the second magenta level indicating super overbought/oversold zones ideal for contrarian trades. I also use a zigzag chart plotting every 100-handle or greater move. Currently, we're down 420 handles without a 100-handle relief rally, making me uncomfortable shorting at these levels.
Around 70% of trend days end in reversals, as bullish trends create selling pressure from profit-taking, while bearish trends generate buying for the same reason. On strong trend days where $ADSPD falls under 300, I often buy 0DTE SPX options anticipating a significant reversal.
Tuesday: Navigating Typically Quiet Days
Tuesday trading builds on Monday's signals, but Tuesdays generally offer minimal action. Few economic calendar events occur on Tuesdays, and major earnings typically fall on Wednesday or Thursday. Perhaps 4-5 Tuesdays per year see significant earnings announcements from companies like Tesla or Microsoft. Tuesdays typically present range-bound conditions with low volume. Any noteworthy Tuesday movement immediately captures my attention since these days usually offer the fewest trading opportunities.
Otherwise, my process mirrors Monday's approach – watching the open, monitoring the opening range, observing SD levels, and reviewing my notes on macro factors, biases, and seasonality.
Wednesday: The Pivotal Day
Wednesday represents the week's most critical day for gaining market edge, with several important considerations. First, I assess whether we've hit a +/-1SD on the weekly scale. If yes, my edge diminishes for the remainder of the week; if no, I maintain my edge. I then check if we've hit the +/-1.5SD on the weekly scale. An affirmative answer means my edge is nearly gone, forcing a day-by-day approach without strong bias. If we haven't hit this level, a gamma squeeze remains possible.
I follow the same intraday trading process as Monday and Tuesday, carefully monitoring daily and weekly levels. Any day we hit -1.5SD weekly, I typically buy without stops and wait to cash in. I don't apply the same approach to +1.5SD because markets tend toward bullishness, and +1.5SD weekly moves can persist.
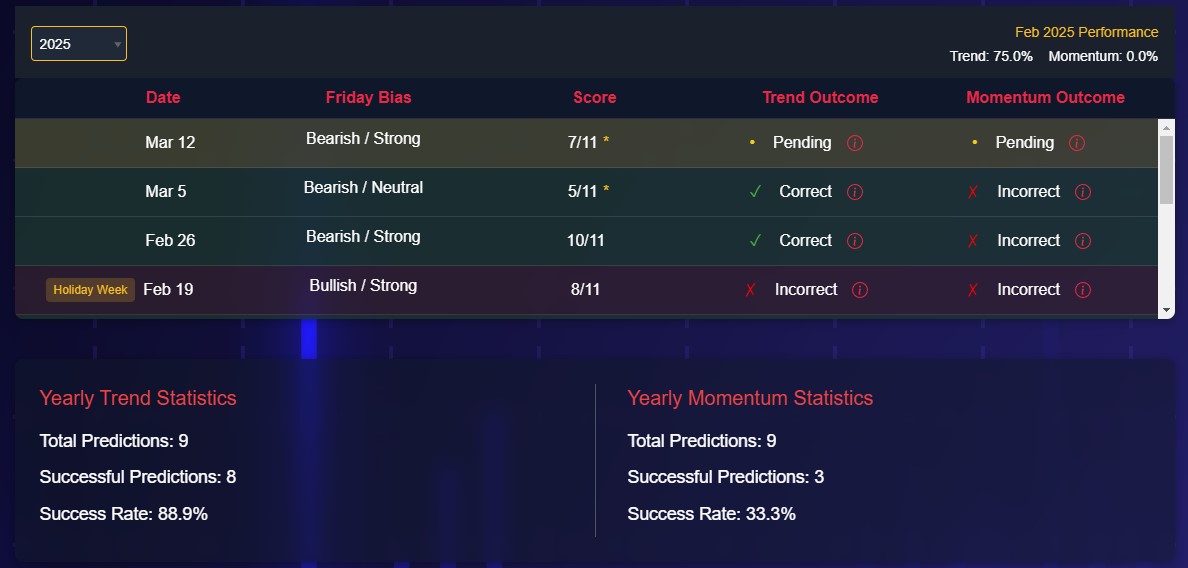
After market close, I develop my Thursday and Friday bias using Simple Sheet analysis, which forecasts Friday's trend direction. Weekly trends resist change, and this tool also indicates conviction strength. I then check the member home section for Confluence Is King, which identifies high-probability Thursday trades where weekly +/-1SD aligns with daily +/-1SD. In volatile markets, patience becomes essential.
Simple Sheet Analysis Methodology
Our Simple Sheet Analysis runs five specific questions with weighted point values to determine both direction and conviction strength:
- Question 1: Have we hit the +/-1 SD before Wednesday close?
- Question 2: Have we hit the +/-1.5SD before Wednesday close?
- Question 3: Where are we on the volume profile?
- Question 4: Where is the daily MACD/RSI?
- Question 5: Where have we closed relative to last Friday's close?
Question 5 determines the trend direction for Thursday/Friday, while questions 1-4 establish the conviction strength. If we've traded every day above the Friday point of control (PoC), I expect the end of week to be bullish, and vice versa. Trading around the PoC within a few handles indicates neutrality.
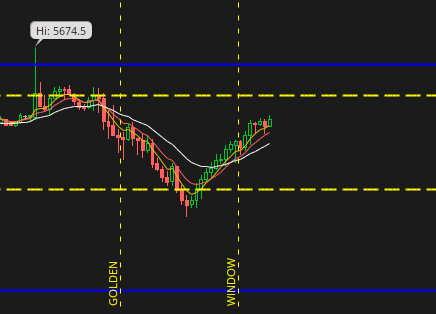
I almost always buy at -1.5SD weekly on Thursdays and hold for a substantial run, especially on Fridays if we reclaim -1SD, which often creates a power hour short squeeze that can make the entire week profitable. Here are two recent examples of pumping from -1.5 weekly SD to -1 weekly SD.
Thursday-Friday: Executing the Weekly Plan
By Thursday, my plan is set. I'm either looking for a +/-1.5SD move, a Confluence is King opportunity, or if these have already occurred, I have minimal edge and must rely on trend analysis. I consider whether the daily expected move is expanding or contracting and whether we've consistently hit the daily expected move this week. I also evaluate relevant economic events, particularly the Thursday unemployment report, which currently outweighs other factors. An unemployment uptick to 5% or higher would trigger significant selling regardless of technical levels, explaining why we've hit the rare -2SD weekly levels.
During highly volatile periods, the -1.5SD weekly level loses some significance compared to normal market conditions. We've hit it multiple times, often closed below it, and even exceeded it – a rare volatility hallmark. Typically, you might reach +/-1.5SD once, after which the market doesn't revisit it that week.
By Friday, if we haven't experienced the gamma +/-1.5SD event on Thursday, I again look for Confluence is King signals. With the entire week's data available and Simple Sheet analysis complete, my bias takes shape. However, if we're trading at -1.5SD and Simple Sheet suggests bearishness, I still buy with appropriate risk parameters.
Daily RSI plays an important role. As of March 12, 2025 ES shows a 25 RSI – "the hole everyone says not to short into." Bears will be trapped. My rule is to never short below 40 RSI on the daily regardless of what the weekly and monthly time frames show. Here is an example of the Friday end of day pump that is constantly mentioned in the Wednesday Newsletter.
Conclusion
This describes my process for using weekly expected moves, daily expected moves, Simple Sheet analysis, and various statistics available on the member home. I created this project to provide myself with readily accessible metrics tailored to my trading approach, eliminating the need to maintain extensive notes or memorize complex relationships. I try to not overtrade, give myself a daily goal and then stop unless there is something juicy in the making. The best money is usually made if you can identify trend vs range. SPXMoves daily levels help with this. Trend days are explosive for quick profit, range days are perfect for slow grind profit. But the best money comes on the Friday afternoon gamma squeezes. Catch one and it makes your whole month!