SPXMoves Indicator for TradingView
Master SPX Trading with Precision Expected Move Levels
$19.99
What You Get
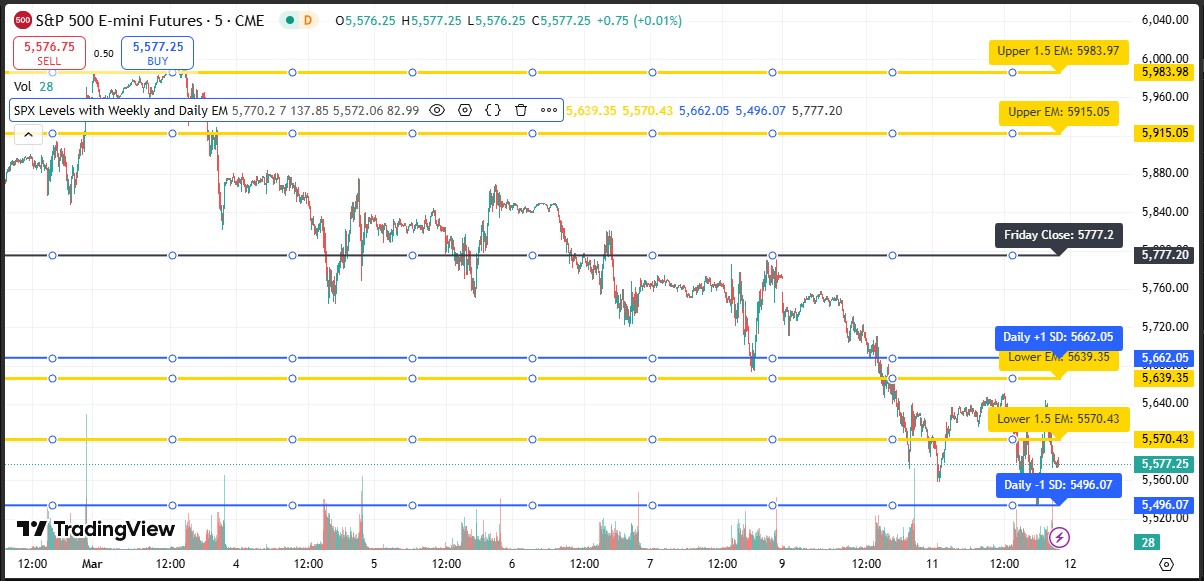
The SPXMoves indicator is a powerful tool designed for S&P 500 traders who need clear, customizable levels based on expected moves. This professional-grade indicator helps you visualize both weekly and daily expected move boundaries directly on your chart.
This package includes BOTH versions:
- Basic Indicator - Simple weekly and daily expected move levels
- Advanced Multi-Day Indicator - Historical tracking, multiple weeks/days, interactive data table
Key Features
- Dual Timeframe Analysis: Track both weekly and daily expected moves simultaneously
- Custom Input Fields: Easily update Friday close values and expected move calculations
- 1.0 and 1.5 Standard Deviation Levels: Visualize multiple probability thresholds
- Color-Coded Lines: Instantly distinguish between weekly (yellow) and daily (blue) levels
- Clear Labels: All levels are clearly labeled with exact price values
- Spread Adjustment: Includes option to factor in futures to cash spread
Perfect For
- Options traders tracking expected move boundaries
- SPX day traders needing clear support/resistance levels
- Swing traders wanting to understand probable price ranges
- Anyone trading S&P 500 derivatives needing precise levels
How It Works
Simply input levels from SPXmoves.com onto the indicator. The indicator automatically calculates and displays all relevant levels on your chart with crystal-clear labels.
Installation
- Purchase this indicator package
- Download the Pine Script files from your email
- In TradingView, open Pine Editor (Chart → Pine Editor)
- Click Open → Import and select the downloaded file
- Click Add to Chart
- Right-click indicator → Settings to adjust values from SPXmoves.com
Note: This indicator requires a TradingView account to use. Get your SPX values from spxmoves.com